Results Sheet
Interpretationimg

This is a Result Sheet generated by an InBody 770 Body Composition Analysis machine.
The Result sheet components remain the same across all other InBody machines.


Inbody India

Free EBook

Professional’s guide

Learn how to read, understand, and use the InBody Result Sheet to maximize your business and validate your programs.

Download Now

Everything you need to know to interpret InBody Results and start offering your clients the insights they need to improve their health & wellness.

The InBody Result Sheet, if used properly, can be one of the most powerful tools at your disposal to guide, train, and care for your clients in ways that were never before possible. However, to unlock the power of the InBody Result Sheet, you need to become familiar with how it reports information, and even more importantly, what you can do with it.

Packed into the InBody Result Sheet is the health and fitness information that anyone who deals with the health and wellness of their clients absolutely needs if they want to be the best professional they can be.

Read More
 
 
  • CHapter 1 Body Composition Analysis & Body Water
  • CHapter 2 Muscle, Fat, and Obesity Risk
  • CHapter 3 Segmental Analysis – Your Magnifying Glass
  • CHapter 4 Customizable Outputs

Chapter 1 txtline

Body Composition Analysis & Body Water

  • 1 Body Composition Analysis

    At the top of the Result Sheet is your client’s basic body composition breakdown.

    body_compo_1

    Depending on the model of InBody you’re using, the breakdown may look a little different, but all models start with the smallest units on the left and gradually get into the bigger categories until you get to the total body weight on the far right.

    In this example, taken from the InBody 770 Result Sheet, you can see how weight is broken down into Lean Body Mass and Total Body Water, which is broken into even smaller pieces: Intracellular Water, Extracellular Water, Dry Lean Mass, and Body Fat Mass.

    Starting from the top, you have Intracellular Water and Extracellular Water. Intracellular Water is the amount of body water held within the body’s cells; Extracellular Water is the water outside the cells. Added together, these make up Total Body Water.

    body_compo_2
    light_icn BREAKING IT DOWN

    Both of these sections are useful in their own right, but monitoring Extracellular Water in particular has a lot of very pertinent uses to health professionals.

    If you notice an increase in ECW, but not ICW, this could be the presence of internal swelling and/or inflammation.

    Below ICW and ECW is Dry Lean Mass (DLM). This is the weight of the protein and mineral content in the body. Although this is an often underused section of the Result Sheet, it can reveal some very interesting insights.

    body_compo_3
    light_icn BREAKING IT DOWN

    Because muscle is made up of mostly protein, and because DLM by definition doesn’t account for body water, if you see your client’s DLM increase, it’s very likely that they have truly gained muscle.

    Below DLM is Body Fat Mass. This reports all of the body fat in the person testing, including both the surface level (subcutaneous) and internal (visceral).

    body_compo_4

    By adding ICW, ECW, and DLM together, you get the total Lean Body Mass (LBM), shown in the second column from the right. LBM is the weight of everything in the body that is not body fat. This includes muscle, water, bones, organs – everything that is not Body Fat.

    body_compo_5

    Most of the time, increases in LBM reflect increases in muscle (which you can also see as an increase in DLM), and is considered a positive improvement in body composition. However, people who do not maintain normal body water ratios may have increased LBM due to swelling caused by certain health conditions.

  • 2 ECW/TBW Analysis

    The ECW/TBW Analysis compares the ratio of ECW to TBW. Most healthy people will have an average ratio of around 0.380, with the acceptable range being between 0.360 – 0.390. Anything beyond 0.390 may indicate swelling or excess ECW.

    body_compo_2

    You’ll see minor fluctuations in your client’s ECW/TBW – that’s normal. This output is primarily used to give context to another section – the Segmental Lean Analysis.

    light_icn BREAKING IT DOWN

    This graph lets you quickly understand if your client has some sort of swelling in his or her body, either in a specific area (like in the case of an injury) or present throughout the entire body (often seen in obese individuals). You can also use this to give context to LBM. High LBM and a high ECW/TBW ratio usually indicate the presence of excess body water – not just muscle.

Chapter 2 txtline

Muscle, Fat, & Obesity Risk

  • 1 Muscle, Fat, & Obesity Risk

    body_compo_1

    For many people, this section of the Result Sheet is one of their favorite sections.

    Why? Because it allows you to categorize different body types more easily. This section makes it simple for you to give your clients a good, general idea about their current overall body composition and what changes they need to make.

    How to read the numbers at the top

    body_compo_2

    The 100% mark, as well as all the percentage marks, are all based on what is considered normal for an individual of the specific height they give when they tested. The markings above the bar graphs allow you to compare your client to others of the same height and gender.

    While the healthy range varies as shown above, 100% designates the average for individuals with the same height and gender. So, if the weight bar extended to 130%, this would mean that the person who you are testing is 30% above average.

    Similarly, if your client’s weight bar extended to 70%, this would mean that your client has 30% less mass than is considered normal for their height.

    light_icn BREAKING IT DOWN

    This graph lets you show your client how their body composition compares against people of the same height and gender.

    Muscle-Fat Analysis has three components:

    WEIGHT Total Body Weight

    SKELETAL MUSCLE MASS (SMM) The total weight of your client’s Skeletal Muscle. These are the muscles that can be grown and developed through exercise. Unlike LBM, which includes everything that isn’t body fat, you can view an increase in SMM as actual muscle gain.

    BODY FAT MASS This is how much body fat your client has, and combines both the surface level and internal fat.

    The Muscle-Fat Analysis also tells you whether your client has a healthy balance of SMM and Body Fat Mass in respect to his or her weight.

    light_icn BREAKING IT DOWN

    The Muscle-Fat Analysis graph allows you to get a rough understanding of your client’s overall body composition in one quick glance. By looking at the lengths of each bar and how they compare to each other, you can better understand how to help your client reach their goals.

    The Basic Body Types: “C-Shape”

    The three values presented in the Muscle-Fat Analysis are arranged in such a way as to make it simple and easy to make general observations about your client’s body composition.

    You do this by forming one of the three “shapes” by connecting the endpoints of the Weight, SMM, and Body Fat Mass bars.

    A C-shaped individual has a shorter bar length for SMM than for weight and Body Fat Mass. Although this is characteristic of someone who is overweight or obese, you may see this shape in someone who is normal or underweight, too.

    body_compo_1
    light_icn BREAKING IT DOWN

    You would want to counsel a client with a Muscle-Fat Analysis graph that looks like this to reduce their Body Fat Mass (which would also lower their Weight) while improving their Skeletal Muscle Mass. Helping this person improve to an I-Shape, and eventually a D-Shape, is the goal.

    The Basic Body Types: “I-Shape”

    An I-shaped individual has a “balanced” body composition, meaning their Weight, Skeletal Muscle Mass, and Body Fat Mass bars roughly form a straight line.

    Although people with this body composition are often at a healthy weight or body fat percentage, they can still have health risks if they have too much body fat.

    body_compo_3
    light_icn BREAKING IT DOWN

    If you’re working with a client that has an I-shaped body composition, you should find out from them what their overall health goals are before making recommendations. Typically, I-shaped people don’t have body compositions that put them at health risks, and so they are in a good position to focus on building muscle to gain strength and size, or lose body fat in order to gain improve overall leanness.

    The Basic Body Types: “D-Shape”

    A D-shaped person has a longer SMM bar than both their weight and body fat bars. This is indicative of an “athletic” body type and is considered to be the ideal body composition shape.

    body_compo_4

    If you are working with a client who has this type of body composition, they likely already have specific fitness goals in mind, and your job will be to help them reach them.

    light_icn BREAKING IT DOWN

    Your client may want to improve their strength and size. In that case, you would want to monitor their SMM bar and Body Fat Mass bars to make sure that SMM increases without a significant increase in Body Fat Mass. Others may want to work on their leanness and lose body fat. For a client with this goal, loss of Body Fat Mass should be monitored while taking care to mitigate loss of SMM. If SMM losses become too great, make adjustments.

  • 2Obesity Analysis

    body_compo_4

    The Obesity Analysis includes the signature metric of any body composition analysis: Percent Body Fat (PBF).

    It’s a deceptively simple metric – a division of body fat mass by total weight – but it is a much better indicator of the risk of obesity than BMI, which is one of the major reasons BMI is still included in the analysis – to highlight its flaws by comparing it to PBF.

    What’s the difference between BMI and PBF?

    body_compo_4

    On the InBody Result Sheet, you’ll see a set of ranges for BMI and PBF. 18.5 –24.99 kg/m2 is the normal range according to the World Health Organization. This normal range is presented on the Result Sheet, although the InBody device can be programmed to use a different range.

    For PBF, the ranges differ for men and women, as women tend to carry more body fat than men due to their reproductive system as well as genetics. The example above is a graph that represents a female individual, and the normal range for females is set at 18-28%, with the average being 23%.

    light_icn BREAKING IT DOWN

    You can show your client their body fat percentage to help them understand their health and fitness better. BMI should not be used. According to the WHO, BMI is a population-level measure of obesity, and a rough guide for individuals.

    The healthy range

    For men, the healthy range is between 10-20%

    body_compo_4

    For women, the healthy range is between 18-28%

    body_compo_4

    If you’d like more information on how InBody sets the PBF ranges for men and women, click here.

  • 3Body Composition History

    body_compo_4

    At the bottom of the Result Sheet is the Body Composition History, which automatically tracks some of the most important body composition metrics. This makes it really easy to identify trends over time.

    Take, for example, the results above. These results represent an athletic, D-shaped individual whose goal was to gain muscle and lose body fat.

    body_compo_4

    As you can see, the program this individual adopted has clearly been successful. In a little over two months, his weight has only increased 2 pounds, yet has gained almost 8 pounds of muscle and dropped his percentage body fat by 2.6%. By any measure, this would be an indication of great success!

    light_icn BREAKING IT DOWN

    If your client’s results look like the above example, the current exercise and/or diet regimen they’ve adopted would appear to be effective. Little modifications to diet or exercise are likely needed, but you should continue to monitor trends carefully.

    Tracking negative change

    The Body Composition History also makes it easy to raise red flags when negative changes in body composition occur, especially when they are disguised by a seemingly “positive” change of reduced body weight.

    body_compo_4

    If you have a client whose graph looks similar, by testing this client’s body composition and seeing their overall trend, you would be able to see that much of this weight loss is due to the slow loss of muscle, leading to a higher percentage body fat.

    light_icn BREAKING IT DOWN

    A graph like this can be a real eye-opener for a client because it shows that negative changes in body composition can occur if his or her weight remains the same or even decreases for the wrong reason. This person needs to be guided towards a solution that helps them retain their muscle mass with some combination of nutrition and strength training.

Chapter 3 txtline

Segmental Lean Analysis

  • 1 Segmental Lean Analysis

    body_compo_1

    There are many valuable outputs on the Result Sheet. However, the Segmental Lean Analysis, if used properly is arguably the most powerful section of the Result Sheet.

    Lean Body Mass vs. Muscle Mass

    In order to fully understand this section, you must fully understand what it is not. The information in the Segmental Lean Analysis shows how much Lean Body Mass is contained in each segment; not how much “muscle” is in each segment.

    This is an important distinction, which you can learn more about in our blog post “Lean Body Mass vs. Skeletal Muscle Mass: What’s The Difference?”

    While it is true that Skeletal Muscle gains in a body segment will be reflected as gains in the Segmental Lean Analysis chart, not every gain in Lean Body Mass can be explained by muscle. That’s because Lean Body Mass also accounts for body water. This makes this chart useful not just for tracking muscle, but also for injury and disease states.
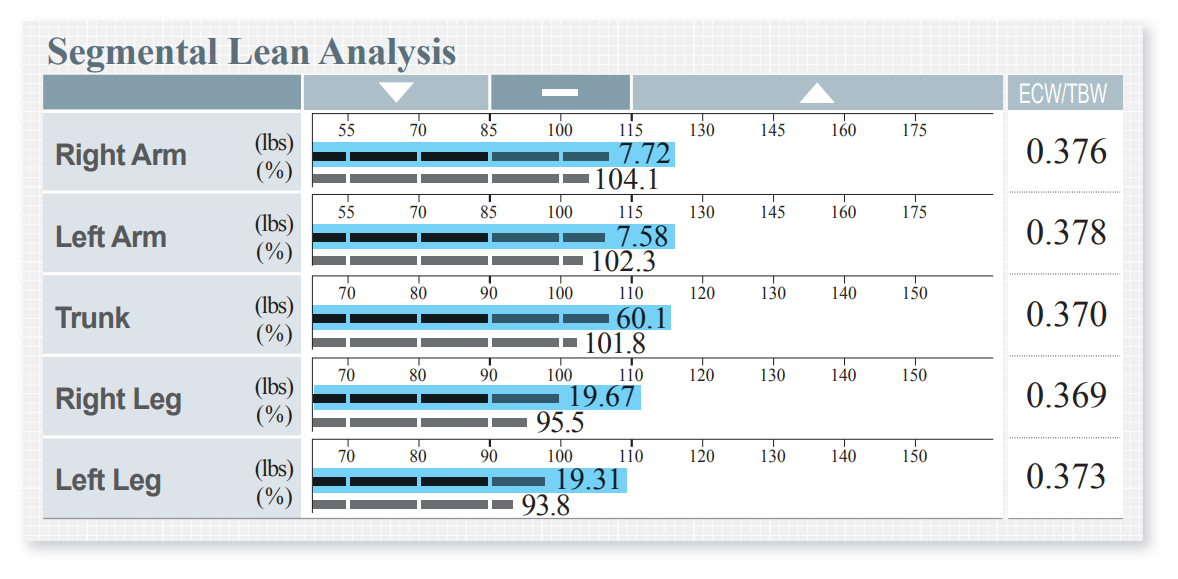
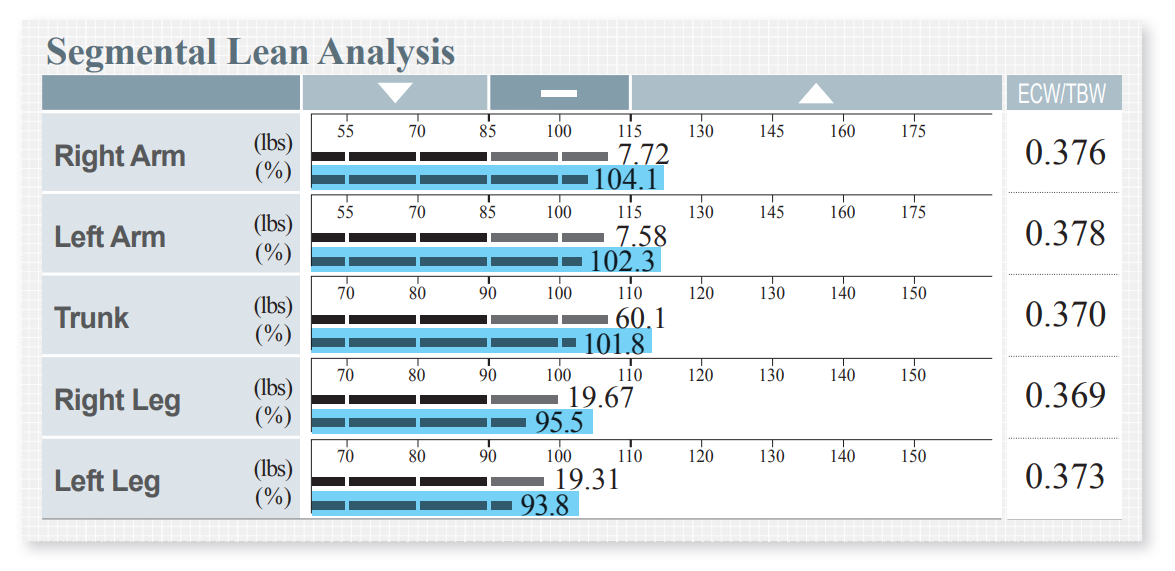
    TOP AND BOTTOM BARS

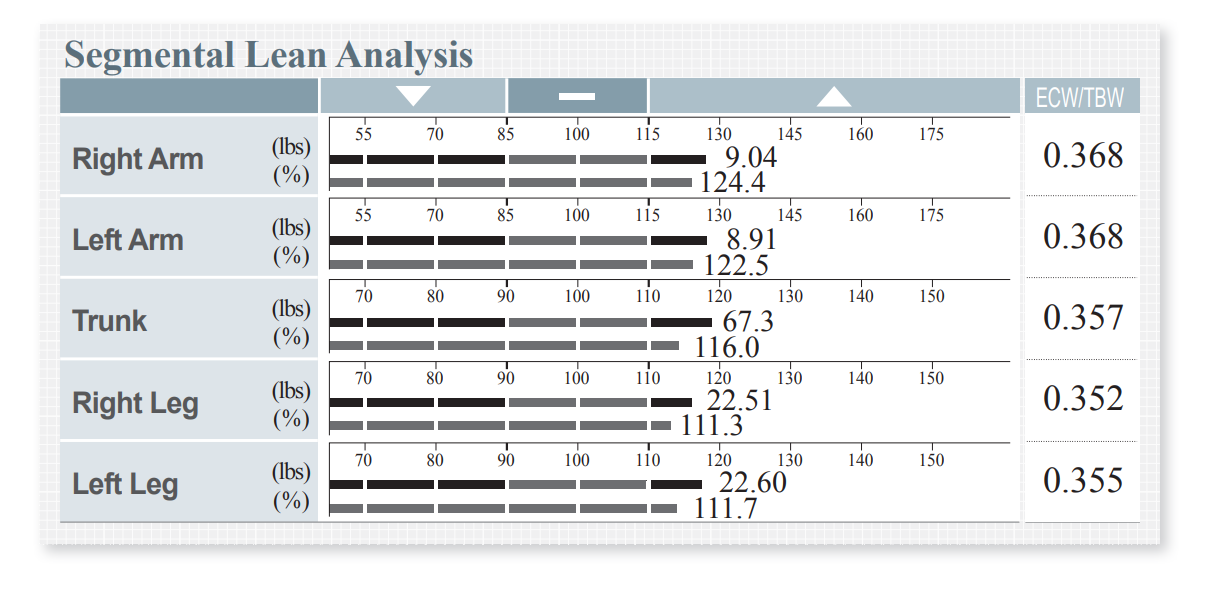
    The InBody divides the body into 5 body segments: the two arms, two legs, and the trunk, which can be thought of as covering the area between the neck and legs. The information for each body segment is reported as two bars.

    THE TOP BAR

    body_compo_1

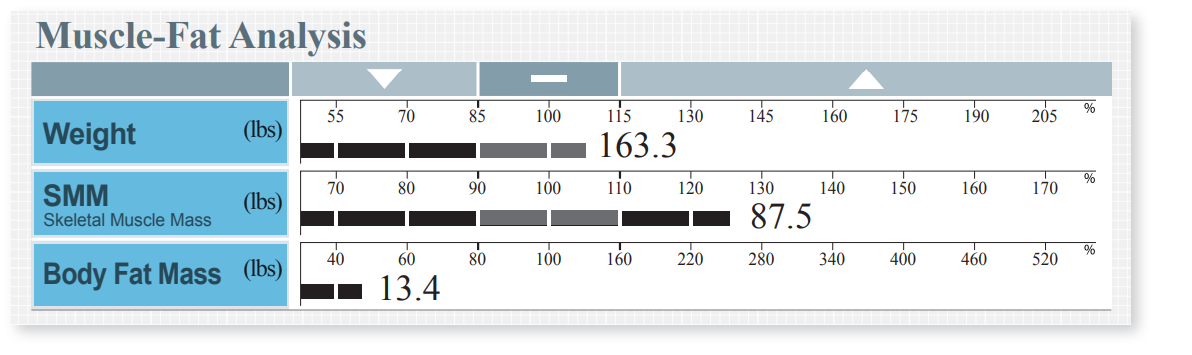
    The top bar shows how much Lean Body Mass in pounds is in a given segment. Just like with the Muscle-Fat Graph, the top bar of the Segmental Lean Analysis compares the pounds of Lean Body Mass against the average expected amount of Lean Body Mass for that person’s height.

    Your clients should always work to be at 100% or higher.

    THE BOTTOM BAR

    The bottom bar is different. The number shown by the bottom bar is the percentage and makes it easier to quickly understand see how close to (or past) 100% each bar extends.

    body_compo_1

    What is this bar showing? It’s comparing your client’s Lean Body Mass against their measured body weight. This shows whether or not your client has enough Lean Body Mass to support their own body weight, where 100% = sufficient.

    light_icn BREAKING IT DOWN

    In the above example, the 3 upper body segments are over 100%, but the lower body segments are not. If you’re working with a client like this, they may benefit from exercises that target Lean Body Mass development in their legs. This will help them achieve a more balance body composition and may have other positive effects, such as body fat reduction, as well.

    Which clients may be at risk for undevelopment?

    Any person can theoretically be underdeveloped in a body segment, and without Segmental Lean Analysis, identifying this can be difficult. However, several groups of clients may be at more risk than others.

    Here are three:

    1. Sedentary adults Sedentary adults who do not exercise commonly have below 100% Segmental Lean Mass especially in their legs, primarily due to jobs that require them to sit throughout most of the day.

    2. “Skinny Fat” individuals (sarcopenic obese)

    People with “skinny fat” profiles have more fat than is healthy for their bodies coupled with a low amount of Lean Body Mass. Their relatively overdeveloped fat or underdeveloped muscle mass contributes to their body weight and may result in scores below 100% for one or more body segment.

    3. The elderly The elderly are at particular risk for not having sufficiently developed Lean Body Mass due to their tendency to lose muscle as a result of increasing inactivity. This impacts their ability to care for themselves as they age and puts them at greater risk of falling and broken bones.

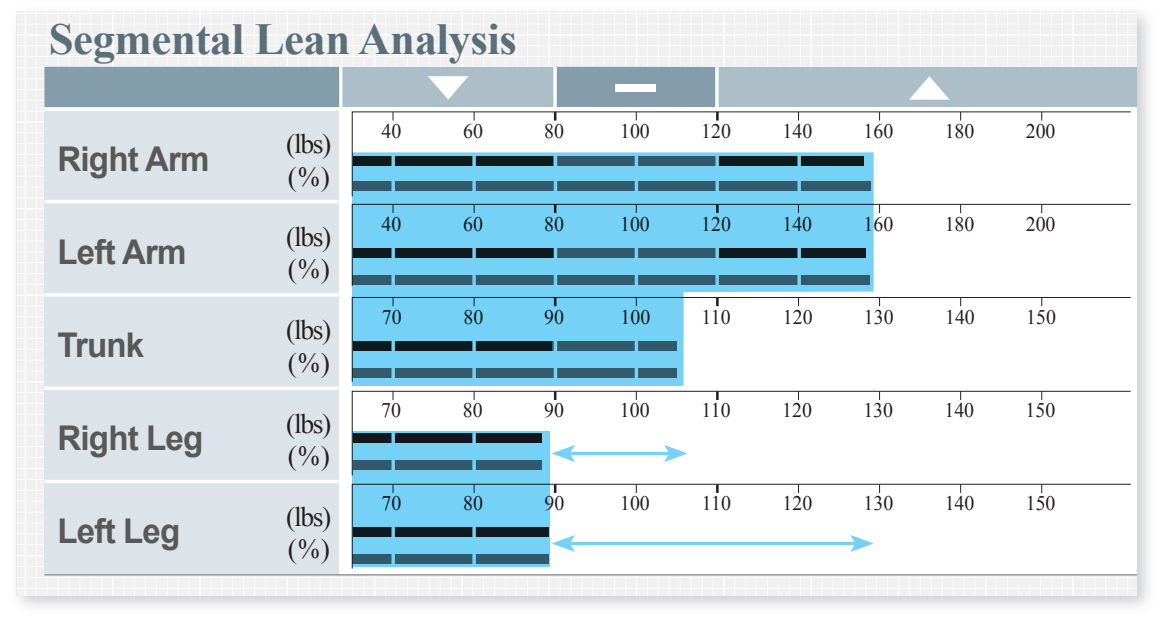
    UPPER/LOWER MUSCLE IMBALANCE Upper/lower body imbalances are fairly common in today’s increasingly sedentary workforce, and you’ll likely encounter cases where the upper body is developed, but the lower body isn’t, like in the example below.

    body_compo_1
    light_icn BREAKING IT DOWN

    If your client looks like this, he or she needs to increase the LBM in their lower legs. Even though the upper body is sufficiently developed, the lower body is still at risk for injury due to the low amount of Lean Body Mass. This client, despite their upper body, risks developing health issues if they keep this body composition.

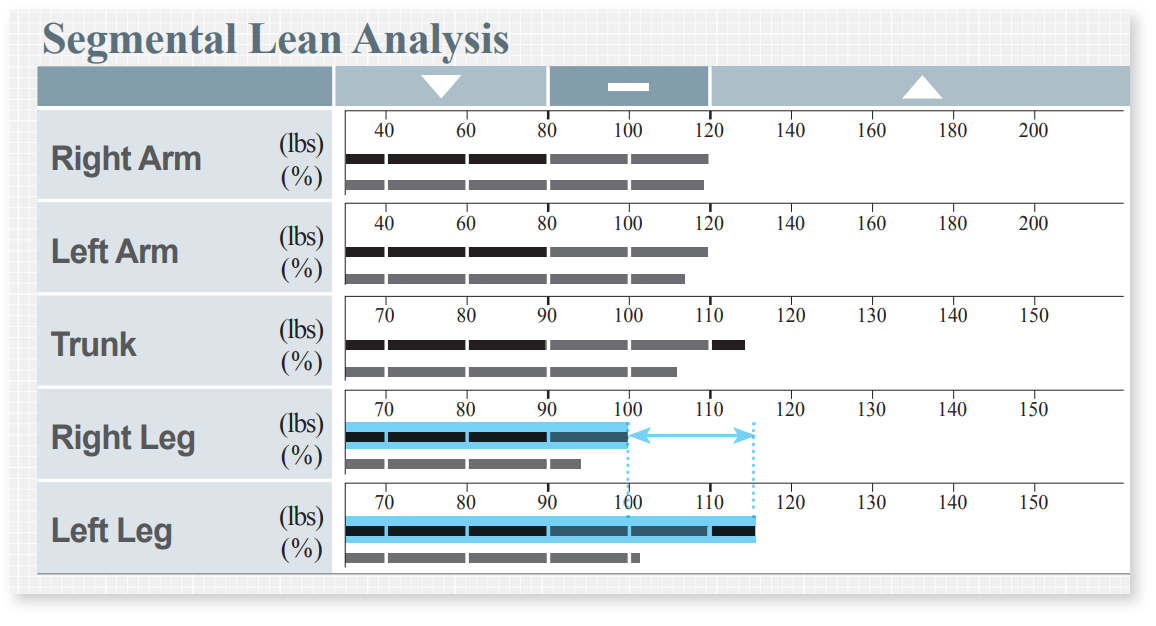
    RIGHT/LEFT MUSCLE IMBALANCE

    Another imbalance the Segmental Lean Analysis can reveal is the imbalance between the right and left arms and/or legs.

    body_compo_1

    Although this client has a balanced upper body, there’s a significant imbalance between the right and left legs. There are many reasons why this could have occurred: For example, an injury can cause swelling and cause the LBM values to go up.

    light_icn BREAKING IT DOWN

    If you are working with a client whose body composition looks like this, it is helpful to find out more about his or her medical history to determine whether an imbalance is due to swelling or from underdeveloped LBM.

Chapter 4 txtline

Body Composition Analysis & Body Water

  • 1 Body Composition Analysis

    On the right-hand side of the Result Sheet are a series of additional outputs that you can mix and match to suit your business needs. Depending on which InBody unit you are using, the outputs available may vary.

    You’ll learn about 4 of the most used outputs. All of these are available on the InBody 770. These are:

    body_compo_1

    VISCERAL FAT AREA

    As you may know, there are two main types of body fat: subcutaneous and visceral. The Visceral Fat Area* graph allows you to determine how much harmful visceral fat your client has.

    body_compo_1

    The graph looks a bit complicated but is actually quite simple to read. The “100” on the left side of the graph represents 100 cm2 of visceral fat.

    You should advise your clients to stay below this line for optimal health and to reduce health risks.

    light_icn BREAKING IT DOWN

    Research has found that visceral fat is particularly influenced by cardiovascular exercise. Encouraging your client to engage in more cardiovascular exercise may improve his or her health by promoting loss of visceral fat.

    * Visceral Fat Level on InBody 570 Result Sheet

    BODY FAT-LEAN BODY MASS CONTROL

    This section makes it incredibly simple to set goals for your client. It is designed to help your client reach their ideal body composition, which is defined as the average PBF for their gender (15% for men, 23% for women).

    body_compo_1

    Depending on your client’s current Muscle-Fat balance, this section of the Result Sheet will recommend adjusting Body Fat Mass and/or LBM in order to reach the target PBF.

    If your client is overfat, the InBody will advise losing a certain number of pounds of fat mass and maintaining or increasing LBM. The InBody will never recommend losing LBM.

    light_icn BREAKING IT DOWN

    These recommendations are meant to be general guidelines for helping individuals achieve optimal health. However, your clients may have their own set of goals, and these should be discussed prior to planning a routine for meeting those goals.

    SEGMENTAL FAT ANALYSIS

    body_compo_1

    In the above example, the person above has 3.3 pounds of body fat in their left arm. For a person of their height and gender, that’s 158.9%, or 58.9% more body fat than the average person with the same height and gender.

    light_icn BREAKING IT DOWN

    This section can be used to track your client’s improvements in body composition and changes in body fat, over time. While studies have shown that you can’t “spot target” body fat with exercise, you can use this section to encourage your clients and give them a more detailed account of the improvements they are making.

    BASAL METABOLIC RATE (BMR)

    The Basal Metabolic Rate, or BMR, is the number of calories your client needs in order to maintain their basic essential functions. This value allows you to guide your clients’ nutritional plans, which is essential to helping them reach their body composition goals.

    body_compo_1


GET IN TOUCHtxtline

 
footer_logo

Hi, my Name Is

I am looking for

and my institution is

My email Id is

My city is

please contact me at

email_icn Contact us by post or just send an email   india@inbody.com